Personal Experiments and Side Projects

Doing silly things with AI. These are real technical projects built to solve personal problems — each one an excuse to think through a design problem using tools I wanted to understand better.

Claude API Last.fm Netlify JavaScript Live Project →

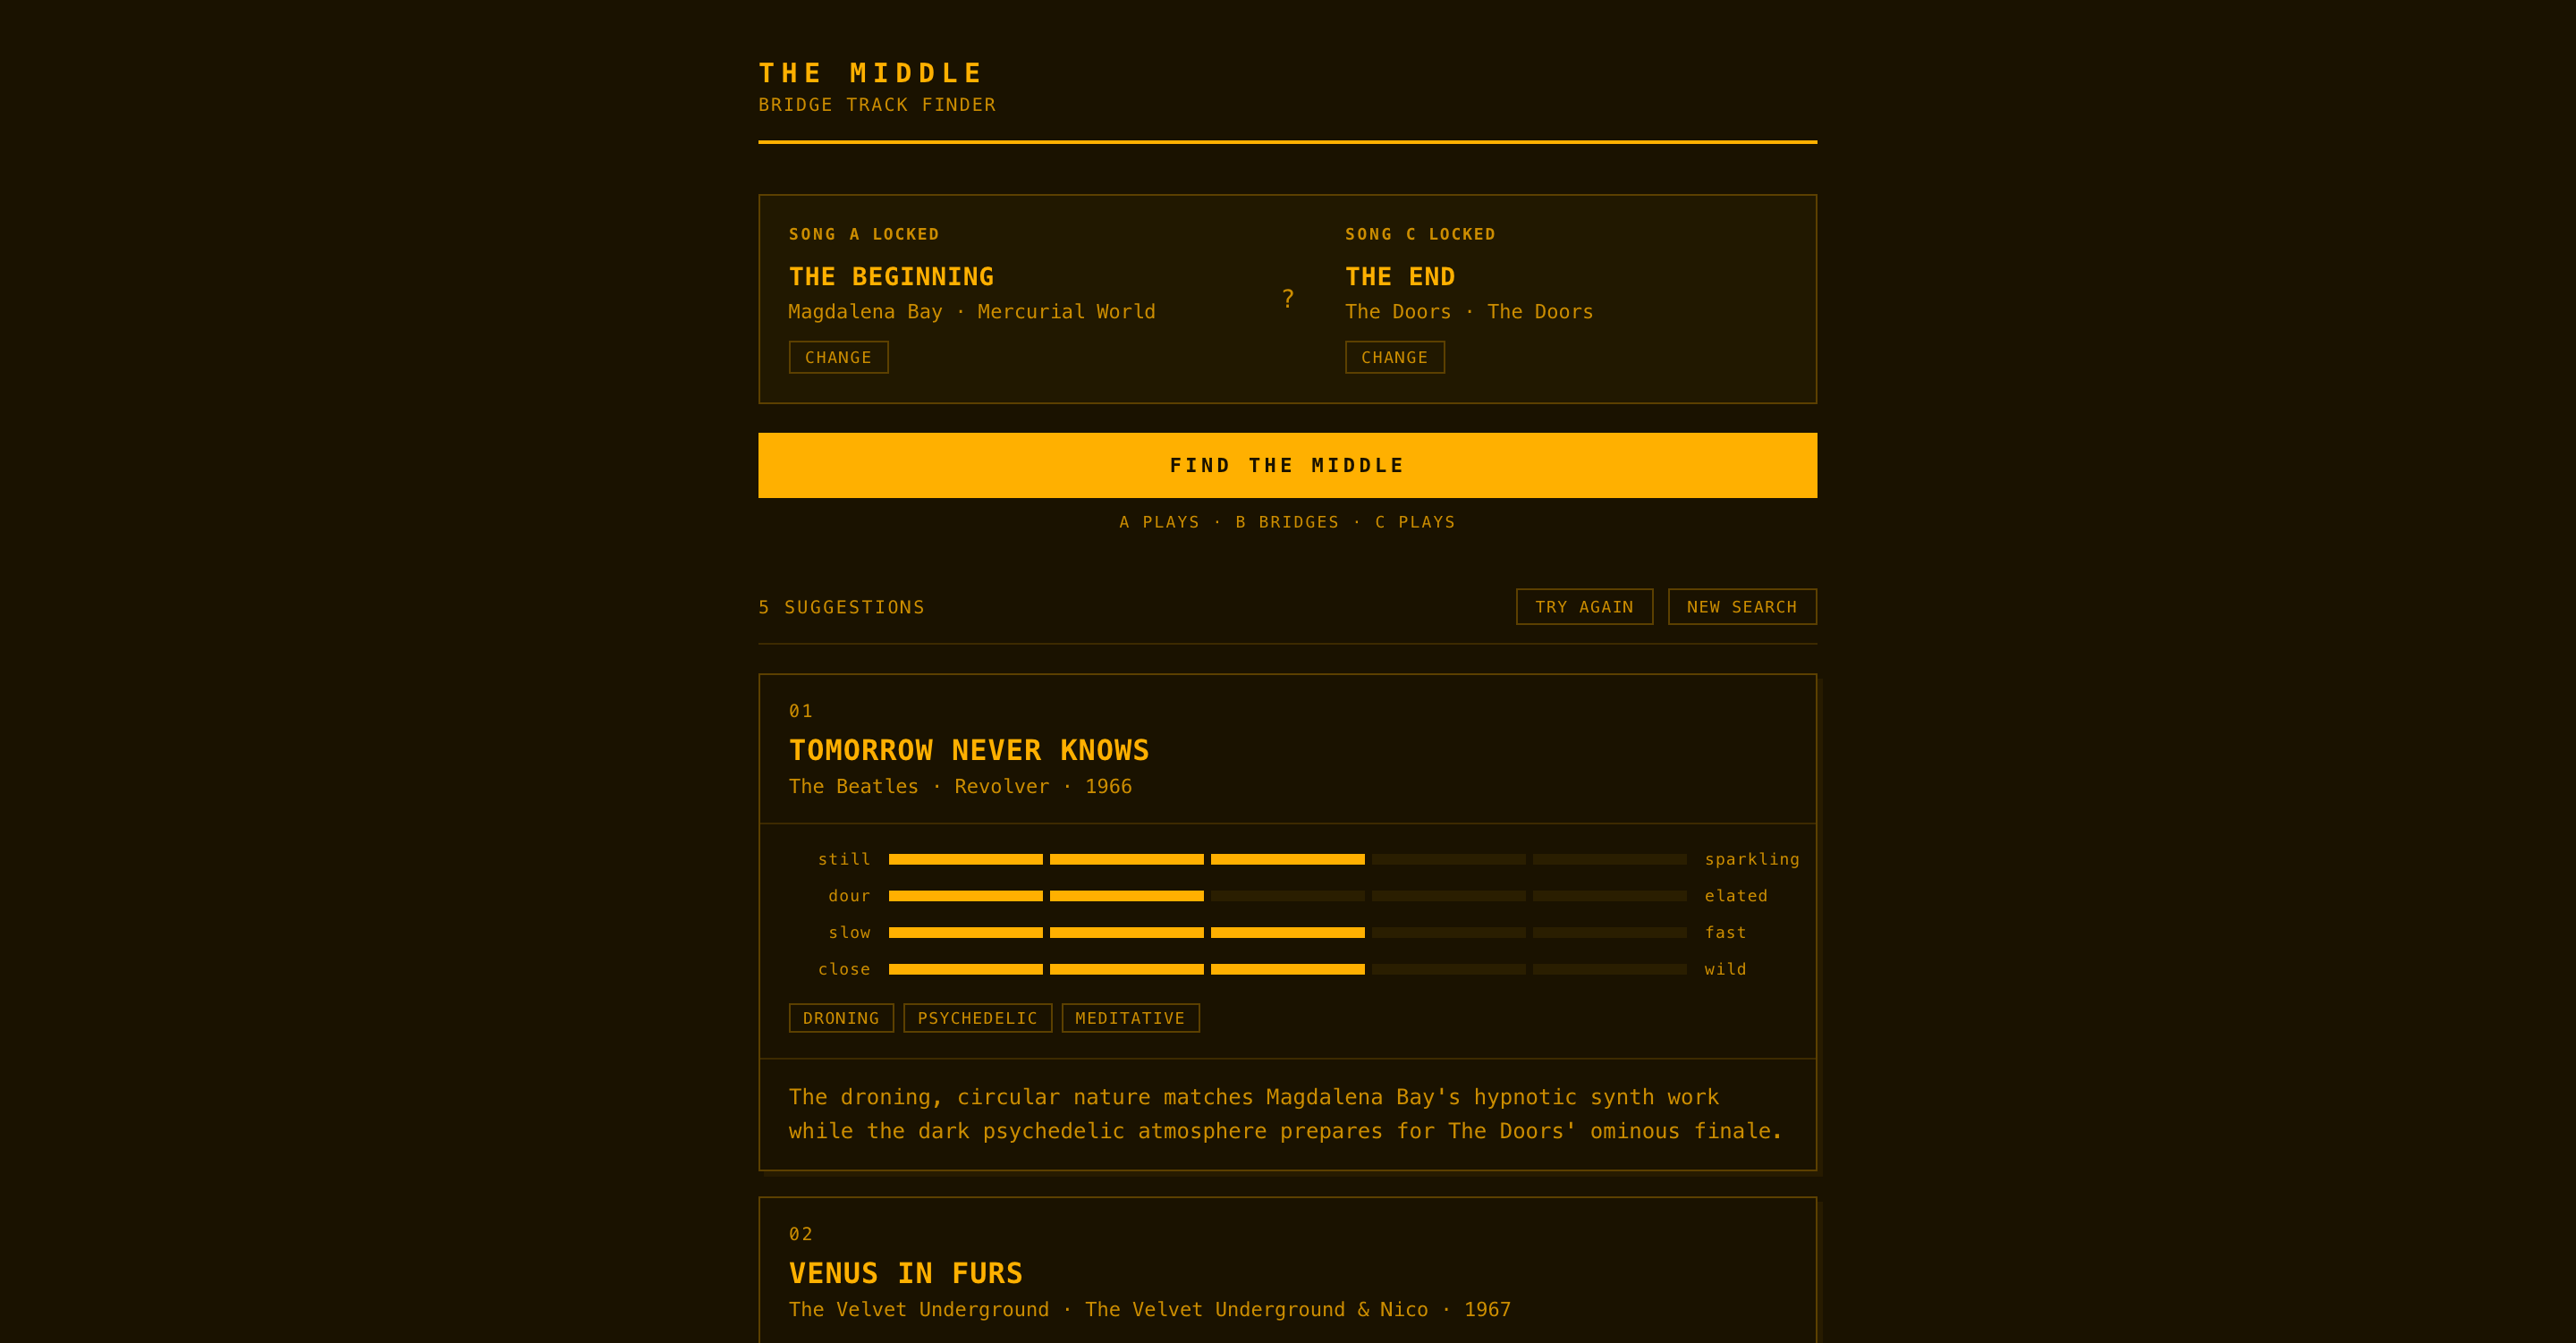
The Middle: Bridge Track Finder

Sequencing music on radio means thinking in transitions. A jarring jump in energy or mood between songs breaks the listener's experience. DJing is picking the right songs to construct a musical journey. I built The Middle to help me find the song that belongs between two others.

The core design problem: A “similar” song isn't the same as a “bridge” song. Recommendation engines find songs that sound alike. A bridge track needs to make the A→C journey feel intentional, thinking directionally, not by averaging.

I encoded that reasoning into a scoring system across four dimensions: Energy (still to sparkling), Mood (dour to elated), Tempo (slow to fast), and Genre Shift (close to wild). Each dimension has tonal anchors I wrote into the prompt — Nine Inch Nails anchors the dour end of Mood; Katrina and the Waves anchors elated, and other songs defined the space between. That specificity gives Claude a shared frame of reference rather than abstract instruction.

The architecture splits the work between what each service does best. Last.fm's similarity graph seeds 50 candidates. Claude then acts as an evaluator (rather than a generator), validating each track against its own knowledge, discarding anything it can't describe with confidence (a hallucination check I added after early testing), and scores the rest. It returns ranked JSON: up to five suggestions with dimension scores, texture tags, and a sentence explaining the bridge logic.

The Genre Shift dimension is where my own taste as a radio host lives. I program an eclectic show — I want the wild end of the scale, mixing genres instead of staying on the path of “similar.” I baked that preference into the prompt, meaning the tool is tuned to my aesthetic, not a generic one.


D3.js Last.fm Discogs Astro Python Claude API Live Project →

Dylan's Music History

Joel Goodman published his Last.fm based music autobiography shortly after I had spent the time building The Middle. He shared his Python scripts with me. I had 21 years of questions about my own listening in all those last.fm scrobbles, so why not answer them?

The data was the first design problem. Three APIs — Last.fm, Discogs, iTunes — none normalized against each other. Last.fm's crowd-sourced tagging is messy by design; a single mislabeled entry can drop a folk band into your electronica section. Rate limits made large queries untenable, so we cached aggressively and accepted the tradeoff: a static document, not a live one.

The visual design problem was different: how do you show 21 years of listening history while not making it endless lists and spreadsheets? Heatmaps, area charts, and scatter plots helped expose the shape of the underlying data — listening spikes in certain years, months-long obsessions, artists that appear and fade over years. With charts, form must follow the function of exposing and understanding the data.

Before a line of code was written, Claude interviewed me — working from an initial Last.fm data dump, asking questions based on Joel’s Claude script about my listening habits and tastes to help surface the narrative within the numbers. That interview became the backbone of the History section. From there, Claude acted as a collaborative partner throughout: brainstorming visualization ideas based on the data at hand, managing the project backlog, handling significant implementation work. I directed design — making decisions, reaching in to fix what bothered me, and steering the overall shape. I see working with AI the way I'd work with a talented junior: capable enough to run with a brief while open and receptive to design notes and guidance.