Role Based Reporting Information Architecture


Cutting the kudzu
At an enterprise data analytics company, consultants in the field reported that customers were struggling with operationalizing the IT service costing product. Product limitations with navigation hurt findability and user paths.
Users
Primary: IT financial analysts (the accountants and finance managers of large company IT departments), IT organizational leaders
Secondary: CIOs, Apptio system administrators
Deliverables
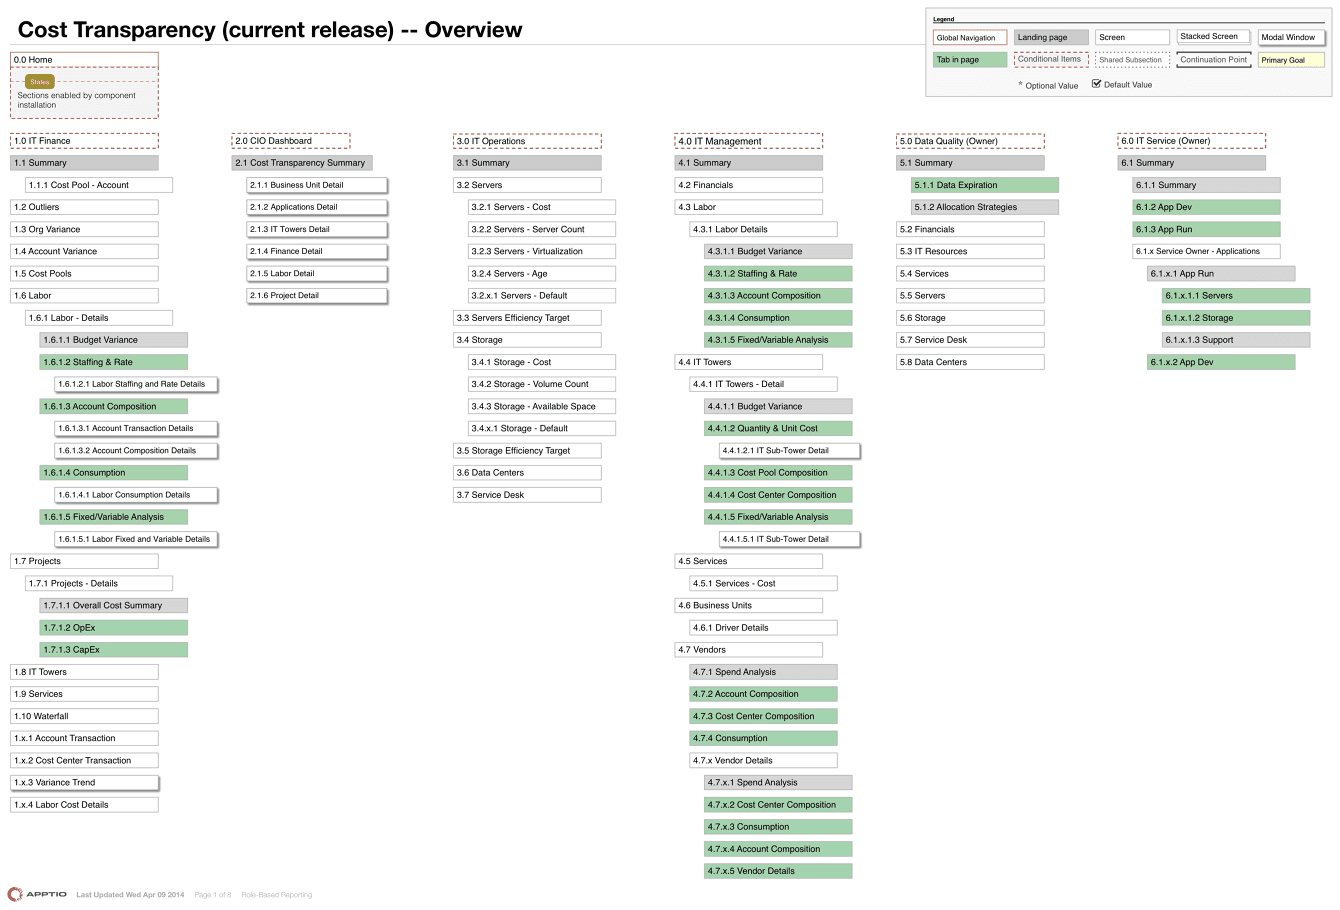
Site Map
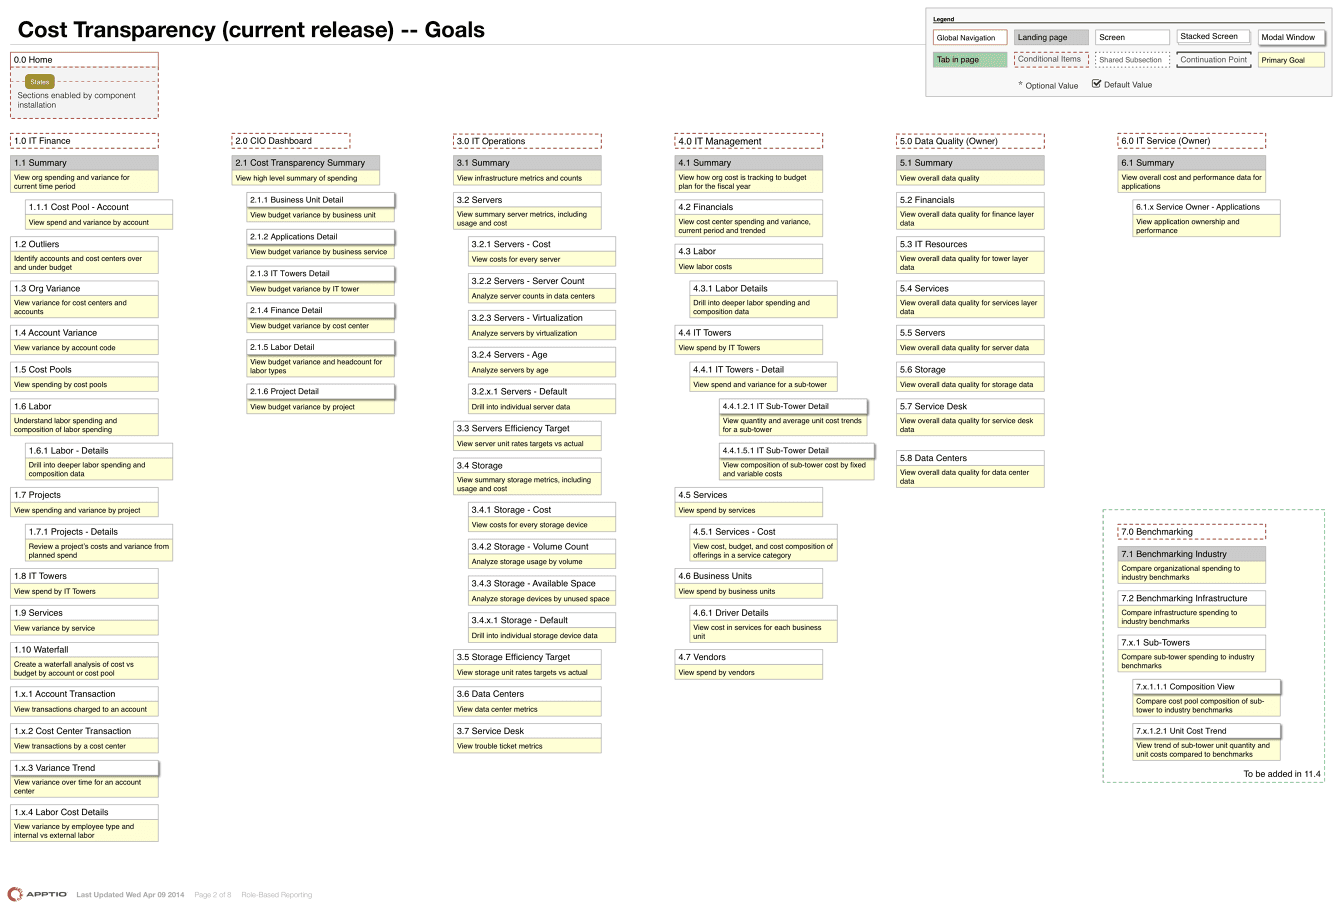
Content Inventory


Process
Process
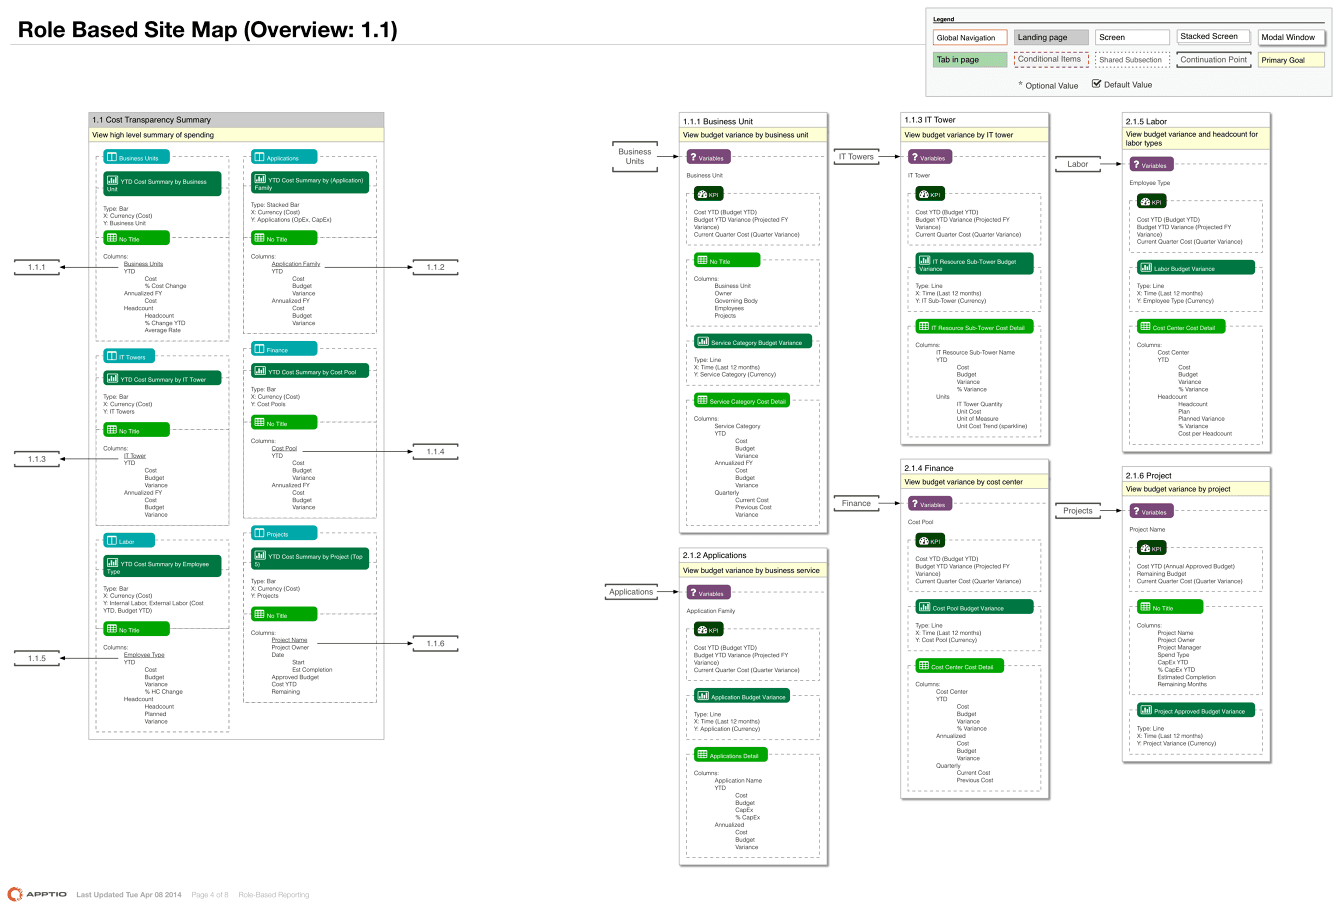
I first laid out the current IA using an in-house design language I was helping to develop. It showed every report’s primary actor, chief user goal, data visualizations, filters and parameters, and whether the data was wide (over the entire organization) or deep (specific to a small part of the organization).
Using Excel, I cataloged all 275 data visualizations in the 96 reports. Each visualization had primary user goals and which actors would have an interest in them. Once these were gathered, I put those into the in-house design language.
We pulled site analytics for a six month period and used e-mail logins to identify the ~8000 users of the product. We used LinkedIn to put a job title and actor to 1000 of them. With this data I was able to see which users were regularly in the product and how they used Apptio.
One pattern I noticed in the data was that while financial analysts were in the system all the time, IT leaders would come in on average less than once a month. Few CIOs ever logged in. With this in mind, I emphasized the financial reporting sections of the site while de-emphasizing reports originally aimed at CIOs. In place of CIO reports I created a section of “wide” reports that gave IT leadership an at-a-glance view of the health of the organization they could easily export.
I created sections for each of the six main actors and laid their primary reports under each. Cost Center Owner (someone who owns a department budget) had no reports, so I proposed new pages for them. I also proposed eliminating nine redundant reports.