Optix Quantify
Company
EnergySavvy


Problem
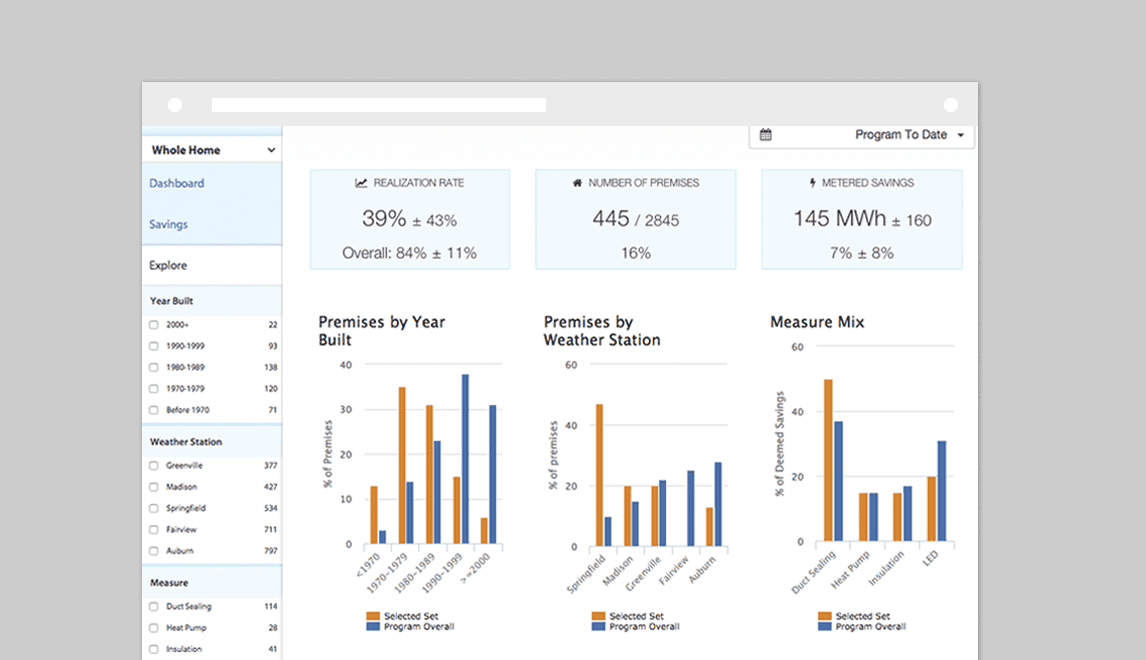
EnergySavvy automates utility energy efficiency programs, helping utilities reduce fossil fuel use. A major issue with these programs is the slow, tedious auditing process, which only happens after program completion, leaving managers without real-time insights. Optix Quantify changes this by using data science to provide real-time visibility into program performance, enabling adjustments on the fly. It also supplies auditors with clean data and tools to communicate with program managers in near real-time.
Users
Primary: Efficiency program managers, efficiency program evaluators
Secondary: Utility company executives
Deliverables
User flows
Wireframes
Information Architecture
Process
Process
Process
This was a greenfield project where the predictive data science hadn't been completed. Thus, we had some time to walk through the UX needs before the devs had finished their investigations.
Research
User and domain research was extensive on this project. I interviewed efficiency program managers and evaluators using remote research techniques. I focused heavily on the pain and the way people did things now. As we built out the picture, the product managers, executive team, and I whiteboarded those pain points and workflows so we could get to a common agreement on the problems we would try to solve.
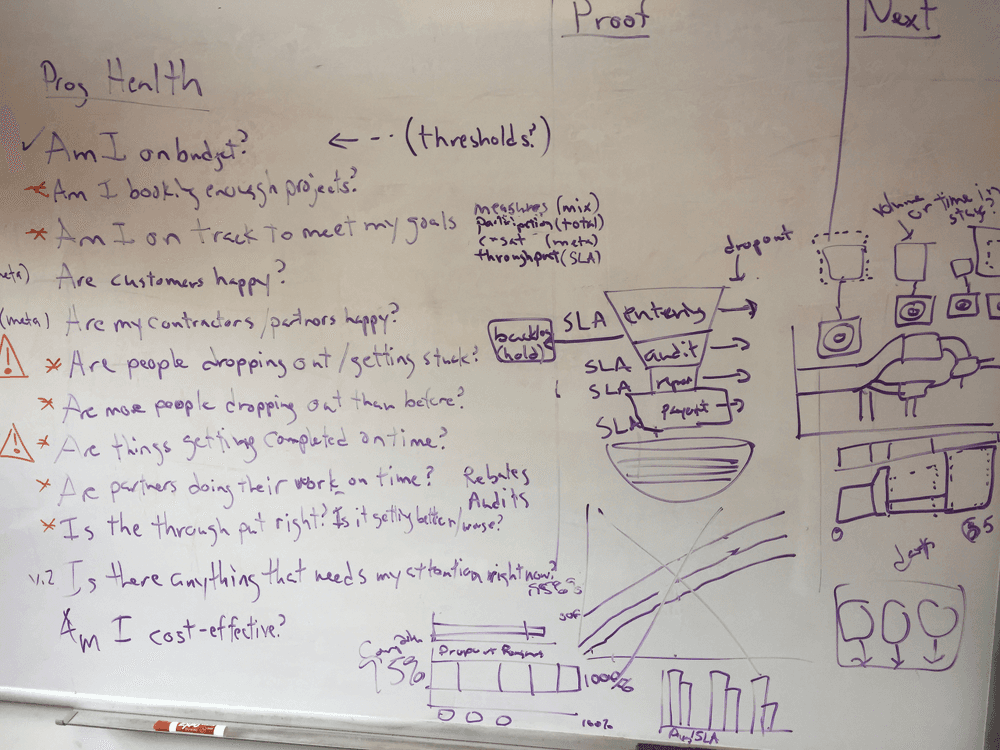
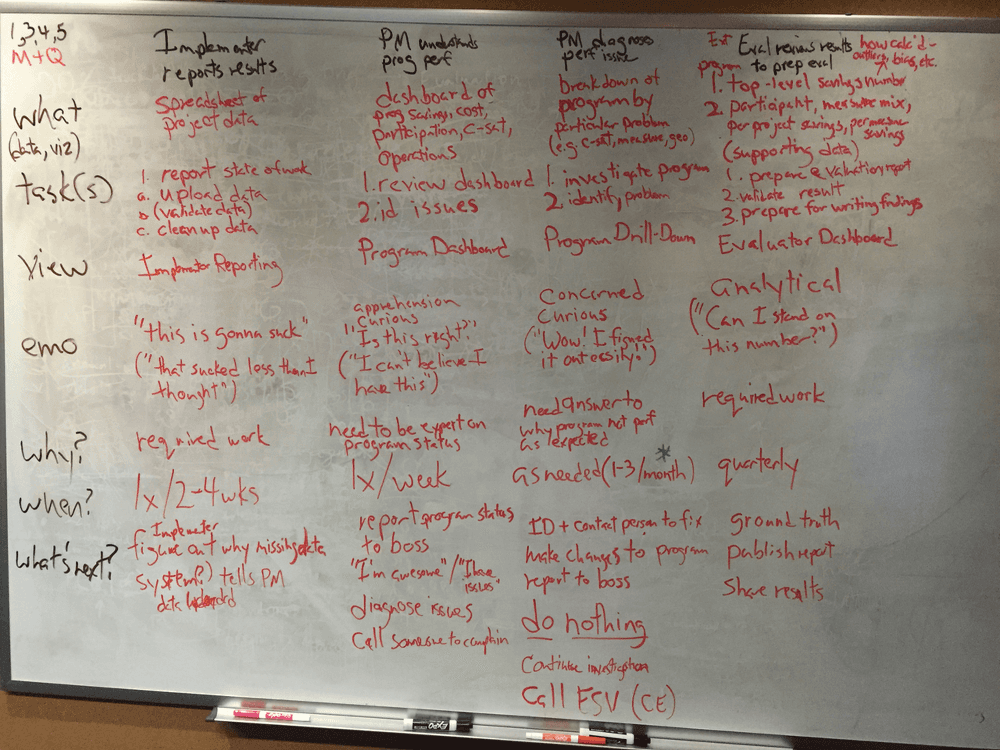
Among our findings:
Evaluators complained of the amount of work they spent on data cleanliness. For them, the pain was data hygiene. If they were lucky, they would receive data dumps of varying quality they can massage in Excel or R. Most of the time, though, they were working with paper evaluation forms they would have to manually input. (My research showed that up to 80% of an auditor's work week centers around cleaning data.)
Program managers were "flying blind;" one explained how they would dump their entire marketing budget into print and TV media in the last quarter of the program cycle because they didn't know if they would hit their program goals.
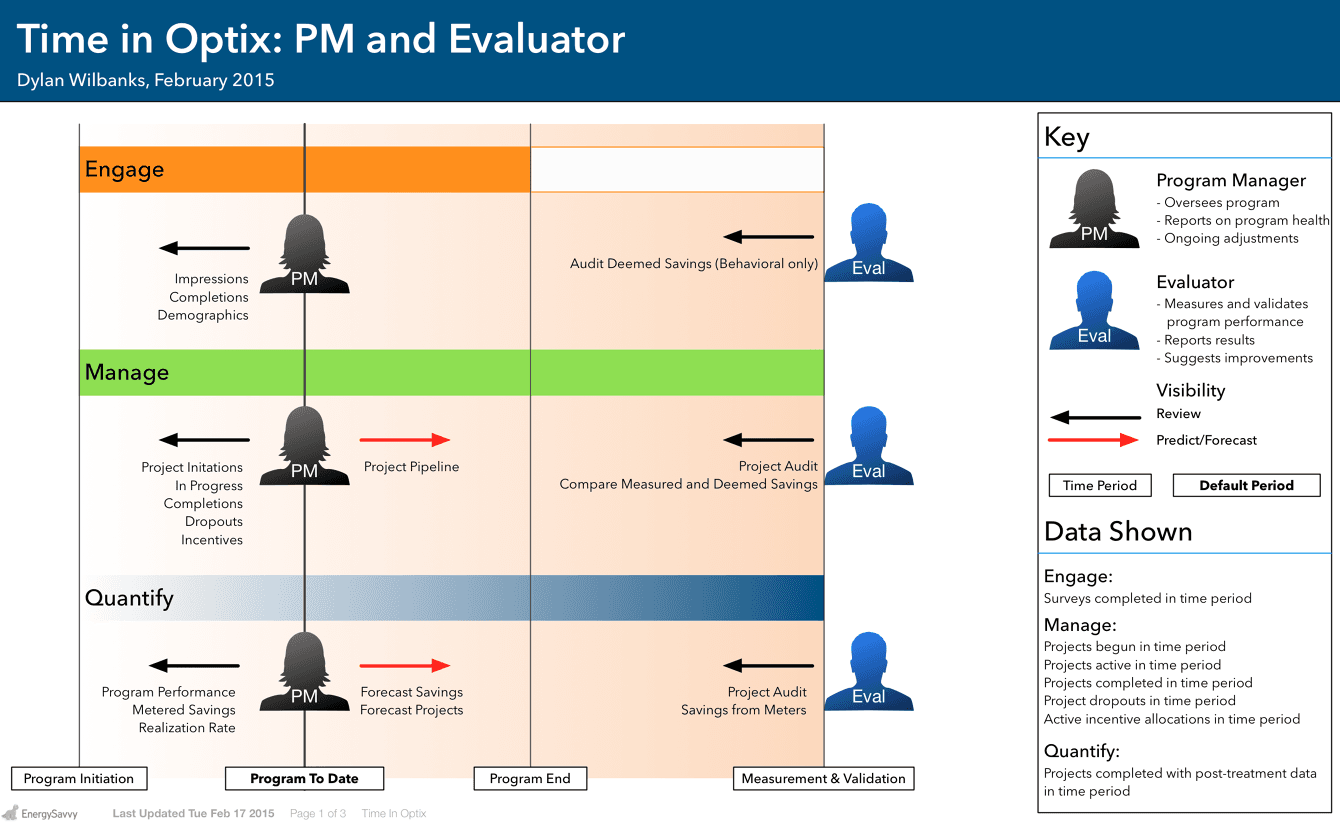
One of the artifacts from these conversations was a model of the time progression of a project evaluation.
Storyboarding and Wireframing
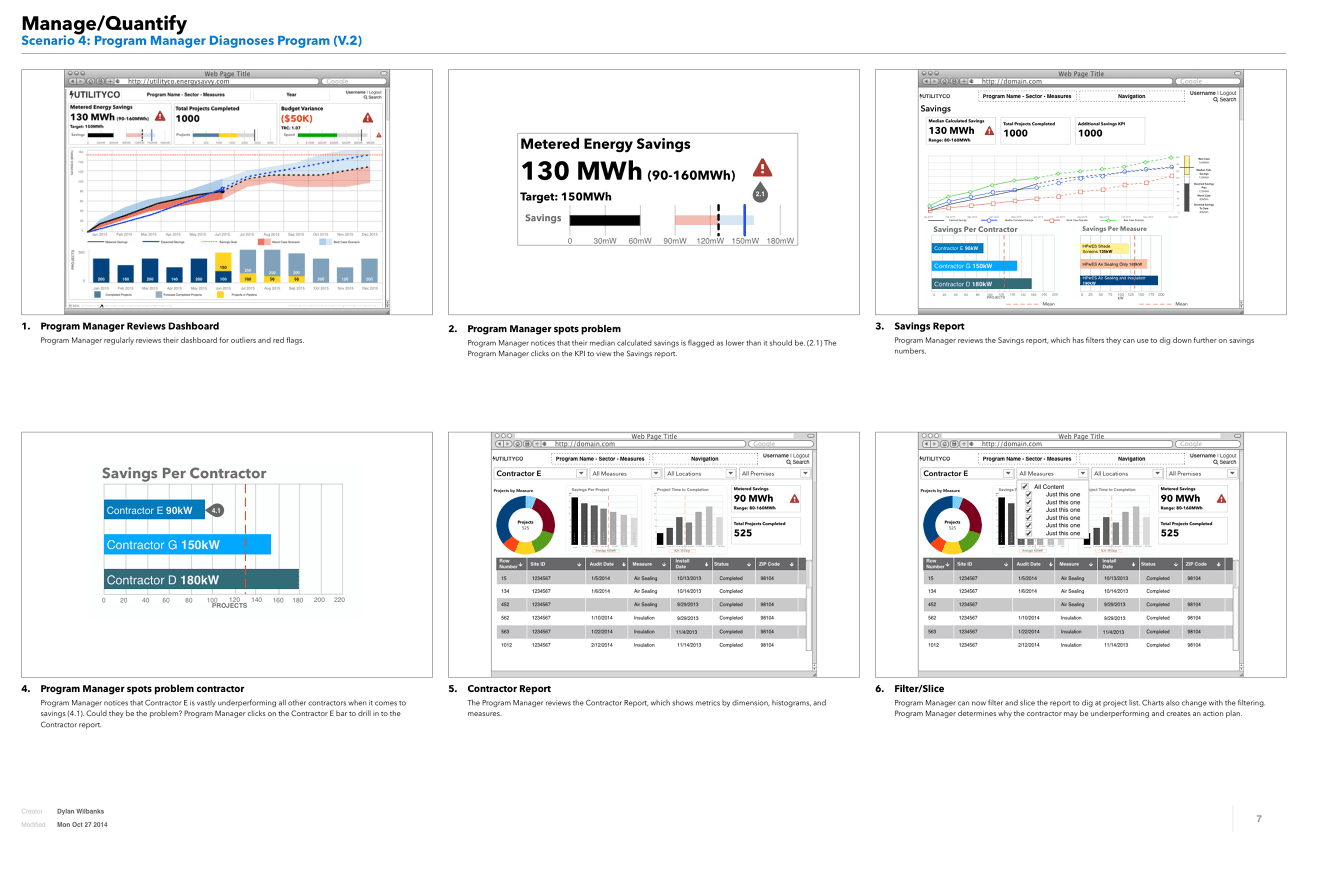
Initially I created storyboards based on our findings to confirm that the design, product, and engineering were all on the same page.
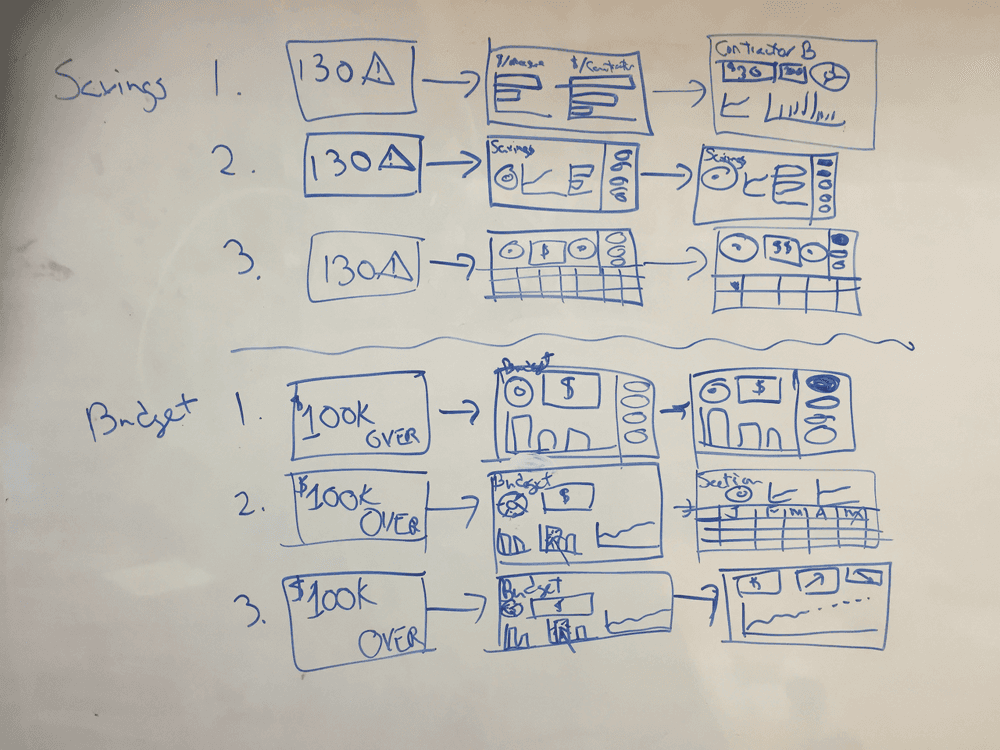
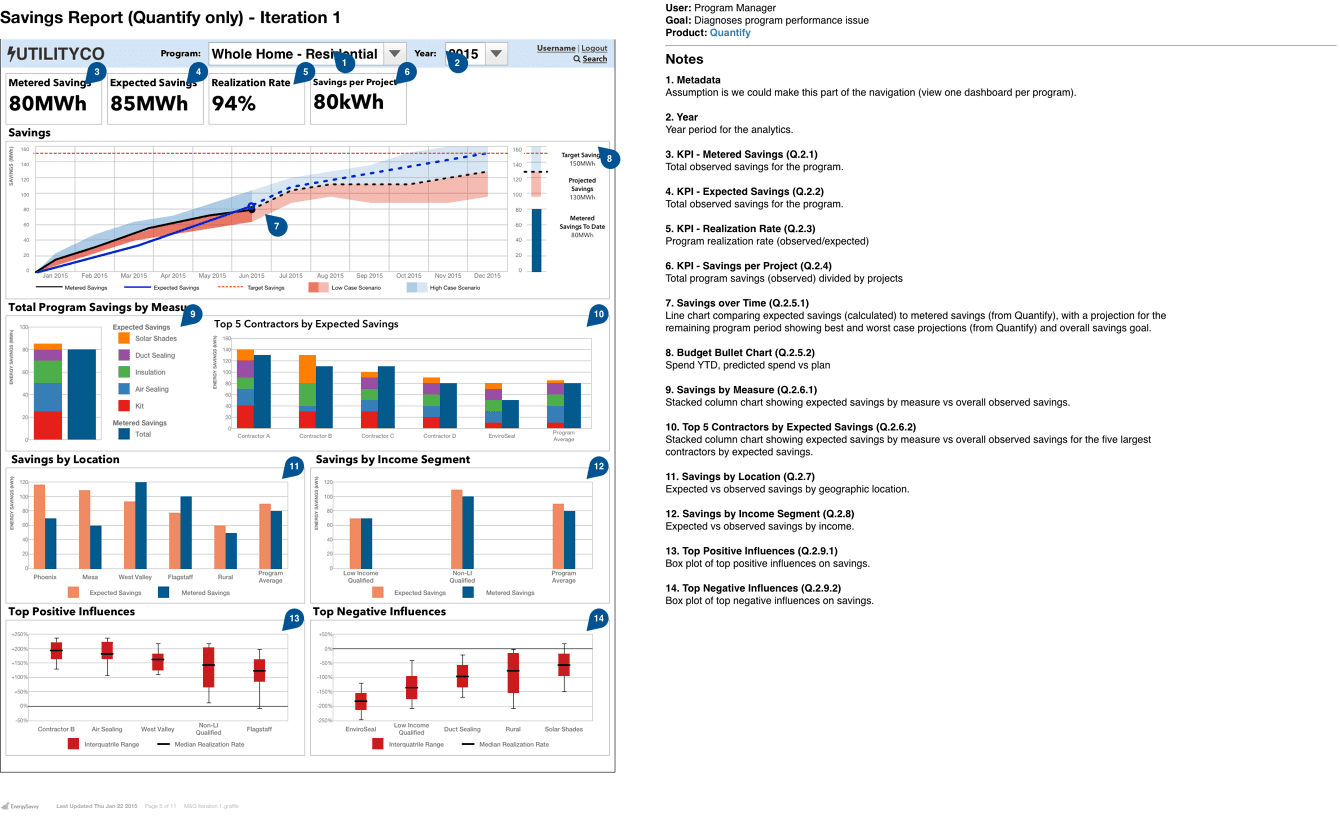
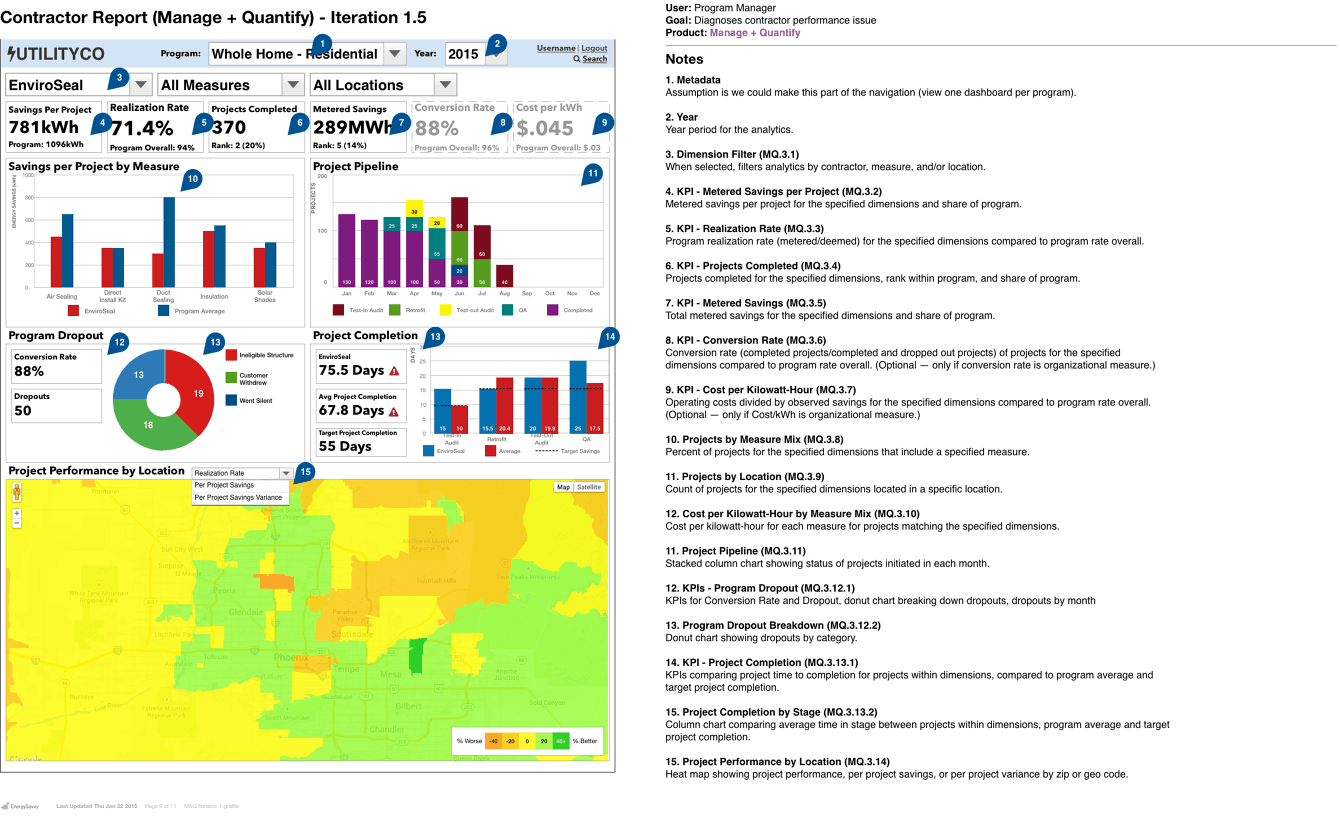
Wireframing went through multiple iterations primarily because the nature of the product suite changed as we went. Quantify was originally supposed to be part of a suite; it shipped as a standalone product.
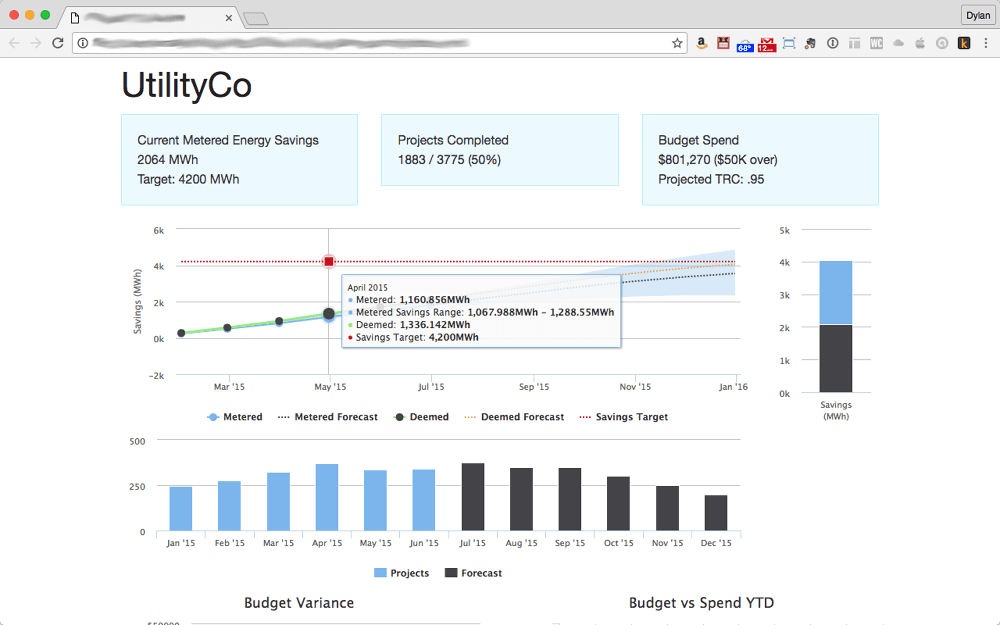
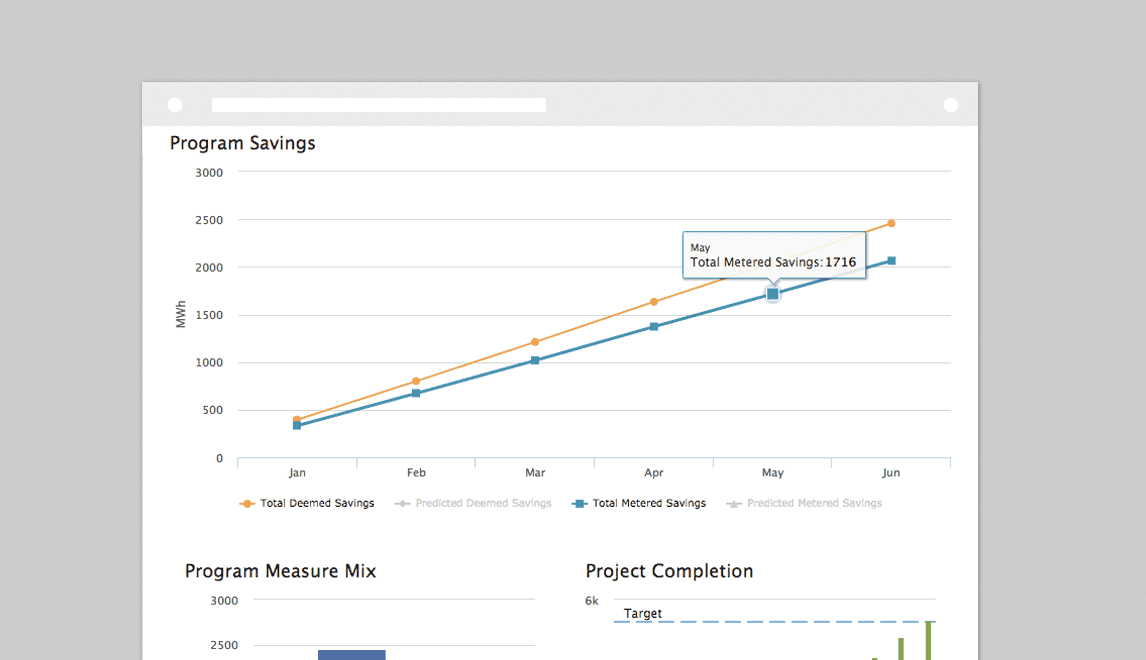
One of the things I delivered to the dev team was a rough prototype of how I expected the interactions to work. I built it in Foundation and HighCharts.
Information Architecture
Because we were thinking about Quantify as part of a broader suite of Optix products, I had to think about how Quantify's IA as a module rather than as a standalone product. Early considerations took this into account.
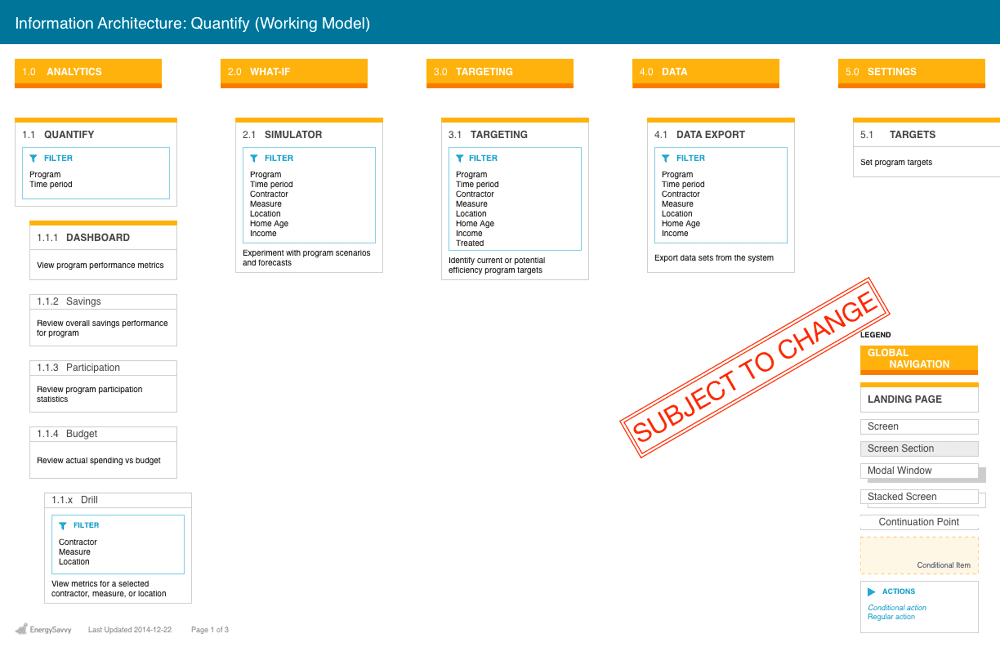
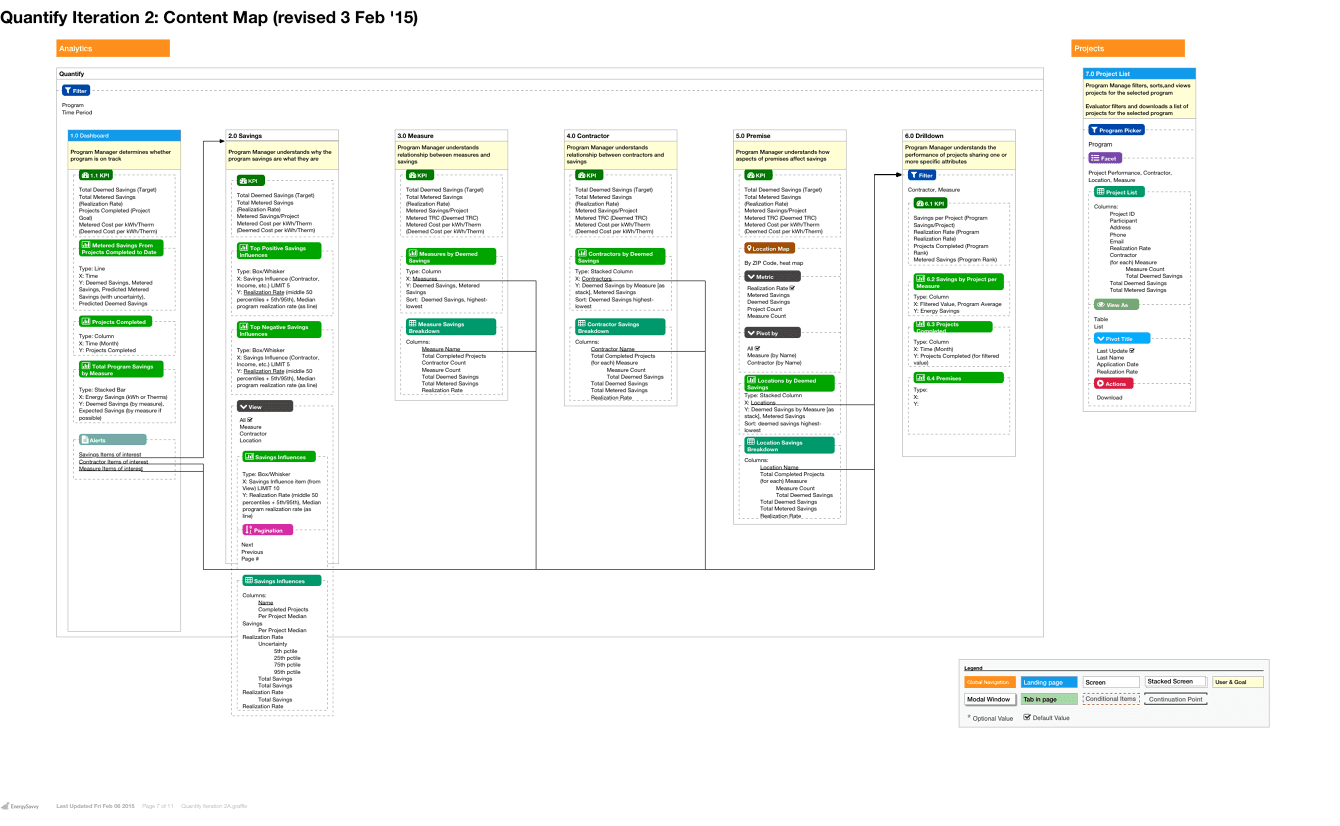
When the product was trimmed to being standalone, I altered the IA and created a content map to lay out the needed content and nav paths.
This project went through multiple product iterations before EnergySavvy shipped the first version to a customer in October 2014.
Process
This was a greenfield project where the predictive data science hadn't been completed. Thus, we had some time to walk through the UX needs before the devs had finished their investigations.
Research
User and domain research was extensive on this project. I interviewed efficiency program managers and evaluators using remote research techniques. I focused heavily on the pain and the way people did things now. As we built out the picture, the product managers, executive team, and I whiteboarded those pain points and workflows so we could get to a common agreement on the problems we would try to solve.


Among our findings:
Evaluators complained of the amount of work they spent on data cleanliness. For them, the pain was data hygiene. If they were lucky, they would receive data dumps of varying quality they can massage in Excel or R. Most of the time, though, they were working with paper evaluation forms they would have to manually input. (My research showed that up to 80% of an auditor's work week centers around cleaning data.)
Program managers were "flying blind;" one explained how they would dump their entire marketing budget into print and TV media in the last quarter of the program cycle because they didn't know if they would hit their program goals.
One of the artifacts from these conversations was a model of the time progression of a project evaluation.

Storyboarding and Wireframing
Initially I created storyboards based on our findings to confirm that the design, product, and engineering were all on the same page.


Wireframing went through multiple iterations primarily because the nature of the product suite changed as we went. Quantify was originally supposed to be part of a suite; it shipped as a standalone product.


One of the things I delivered to the dev team was a rough prototype of how I expected the interactions to work. I built it in Foundation and HighCharts.

Information Architecture
Because we were thinking about Quantify as part of a broader suite of Optix products, I had to think about how Quantify's IA as a module rather than as a standalone product. Early considerations took this into account.

When the product was trimmed to being standalone, I altered the IA and created a content map to lay out the needed content and nav paths.

This project went through multiple product iterations before EnergySavvy shipped the first version to a customer in October 2014.
Process
This was a greenfield project where the predictive data science hadn't been completed. Thus, we had some time to walk through the UX needs before the devs had finished their investigations.
Research
User and domain research was extensive on this project. I interviewed efficiency program managers and evaluators using remote research techniques. I focused heavily on the pain and the way people did things now. As we built out the picture, the product managers, executive team, and I whiteboarded those pain points and workflows so we could get to a common agreement on the problems we would try to solve.


Among our findings:
Evaluators complained of the amount of work they spent on data cleanliness. For them, the pain was data hygiene. If they were lucky, they would receive data dumps of varying quality they can massage in Excel or R. Most of the time, though, they were working with paper evaluation forms they would have to manually input. (My research showed that up to 80% of an auditor's work week centers around cleaning data.)
Program managers were "flying blind;" one explained how they would dump their entire marketing budget into print and TV media in the last quarter of the program cycle because they didn't know if they would hit their program goals.
One of the artifacts from these conversations was a model of the time progression of a project evaluation.

Storyboarding and Wireframing
Initially I created storyboards based on our findings to confirm that the design, product, and engineering were all on the same page.


Wireframing went through multiple iterations primarily because the nature of the product suite changed as we went. Quantify was originally supposed to be part of a suite; it shipped as a standalone product.


One of the things I delivered to the dev team was a rough prototype of how I expected the interactions to work. I built it in Foundation and HighCharts.

Information Architecture
Because we were thinking about Quantify as part of a broader suite of Optix products, I had to think about how Quantify's IA as a module rather than as a standalone product. Early considerations took this into account.

When the product was trimmed to being standalone, I altered the IA and created a content map to lay out the needed content and nav paths.

This project went through multiple product iterations before EnergySavvy shipped the first version to a customer in October 2014.
Results
Results
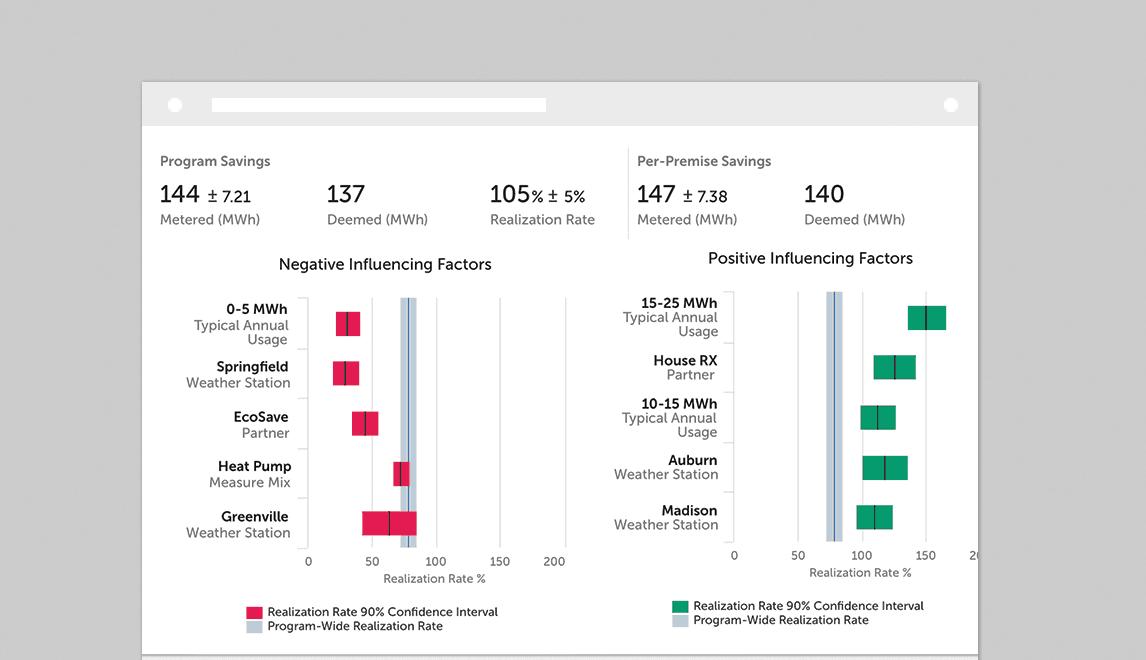
EnergySavvy shipped the first proof-of-concept in October to an initial customer enthusiastic to sign up. Evaluators (program auditors) began requiring the software in their contracts with utilities.
Lessons
If you communicate well, delegate effectively, and keep folks focused on the problem we’re trying to solve and not distractions, you’ll be successful. Doubly so if you’re working on both a new product and a rethink of the overall platform. (Hard learned lessons.)


