Problem
At Apptio, an enterprise data analytics company, customers struggled to operationalize the IT service costing product. Navigation limitations hindered discoverability and user workflows, creating friction in how financial analysts and IT leaders accessed critical reporting.
Primary Users: IT financial analysts and IT organizational leaders
Secondary Users: CIOs, system administrators
Approach
Conducted a multi-phase research initiative:
Information Mapping
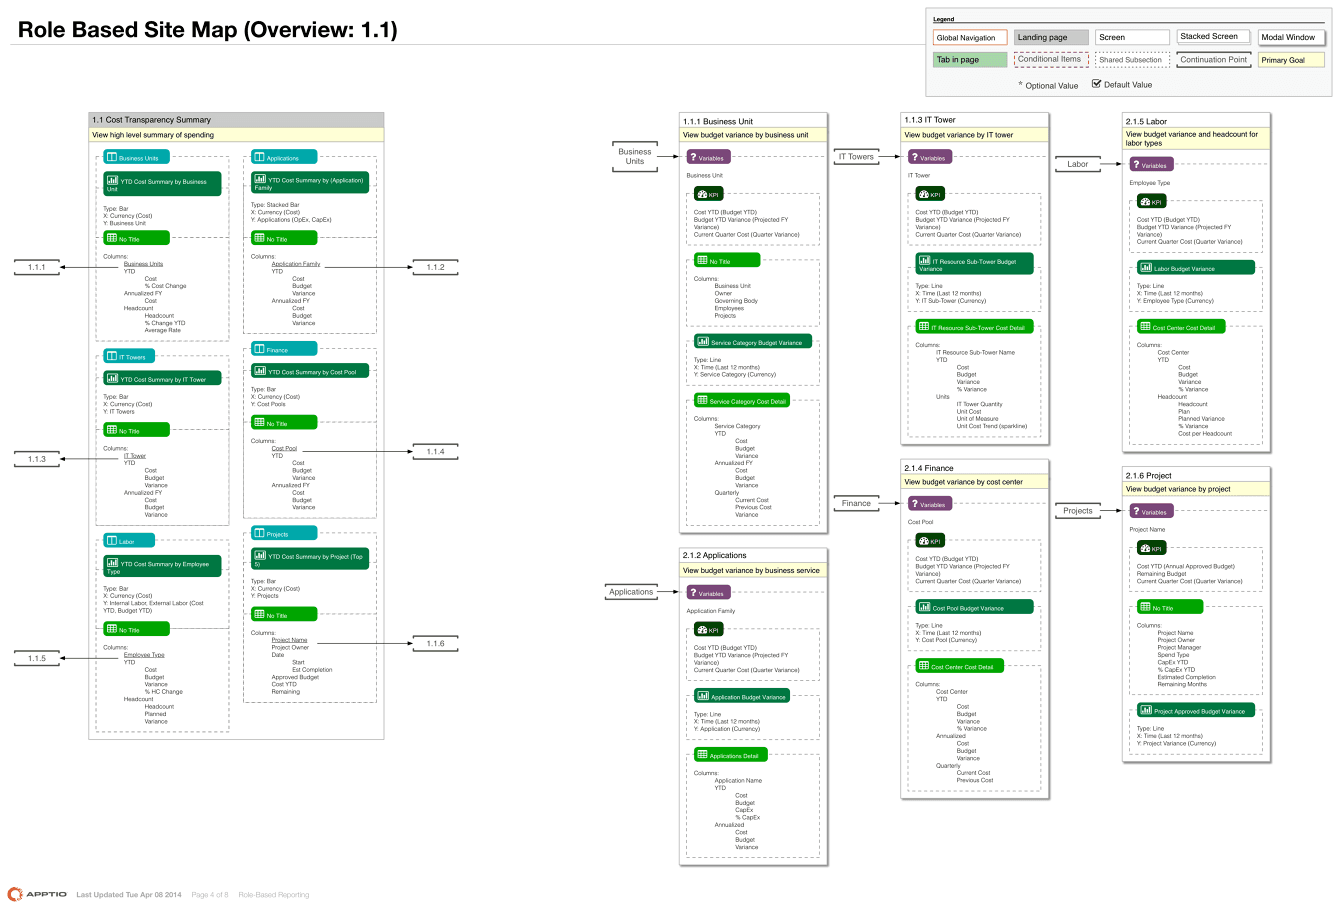
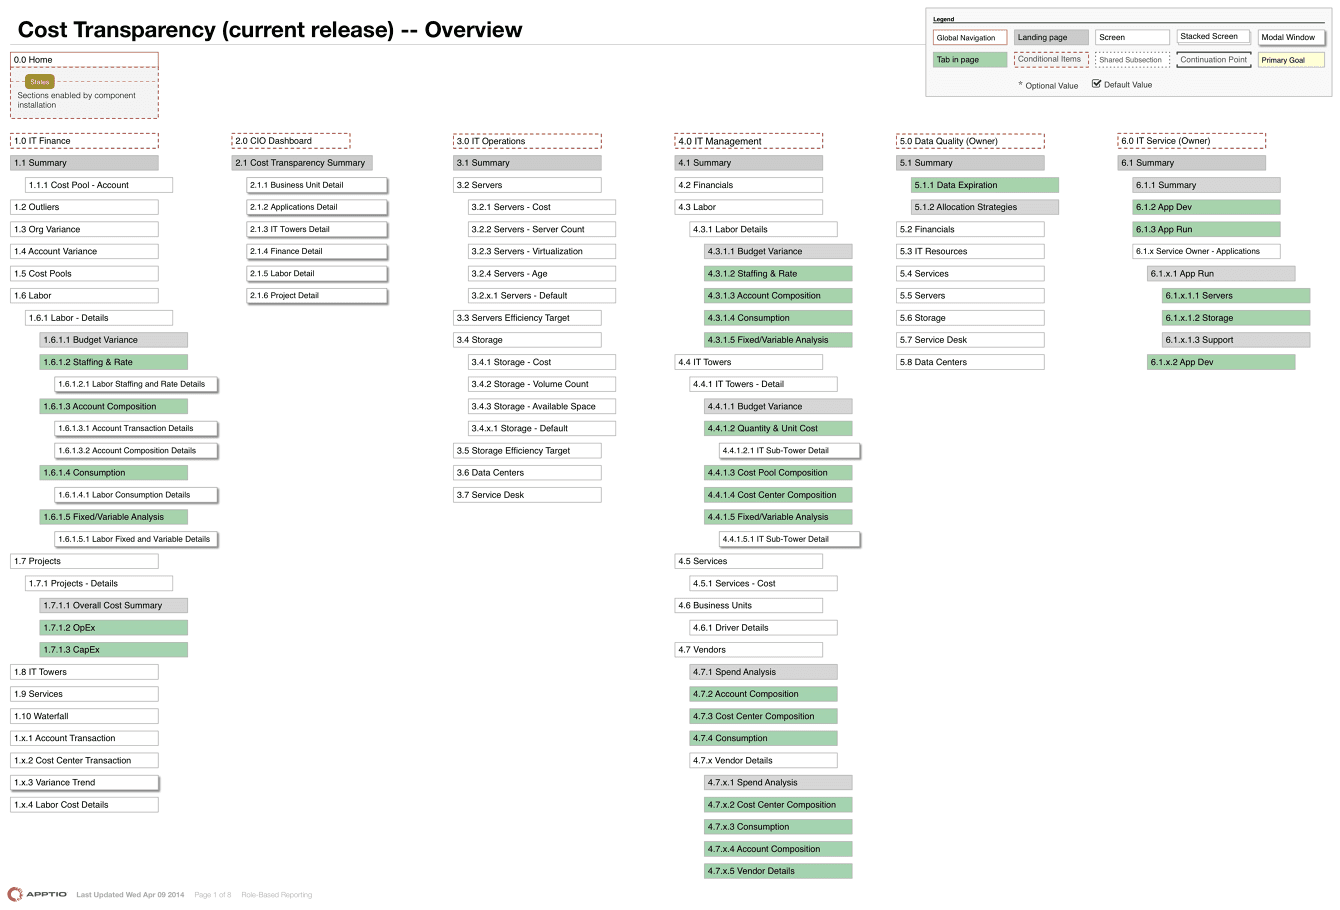
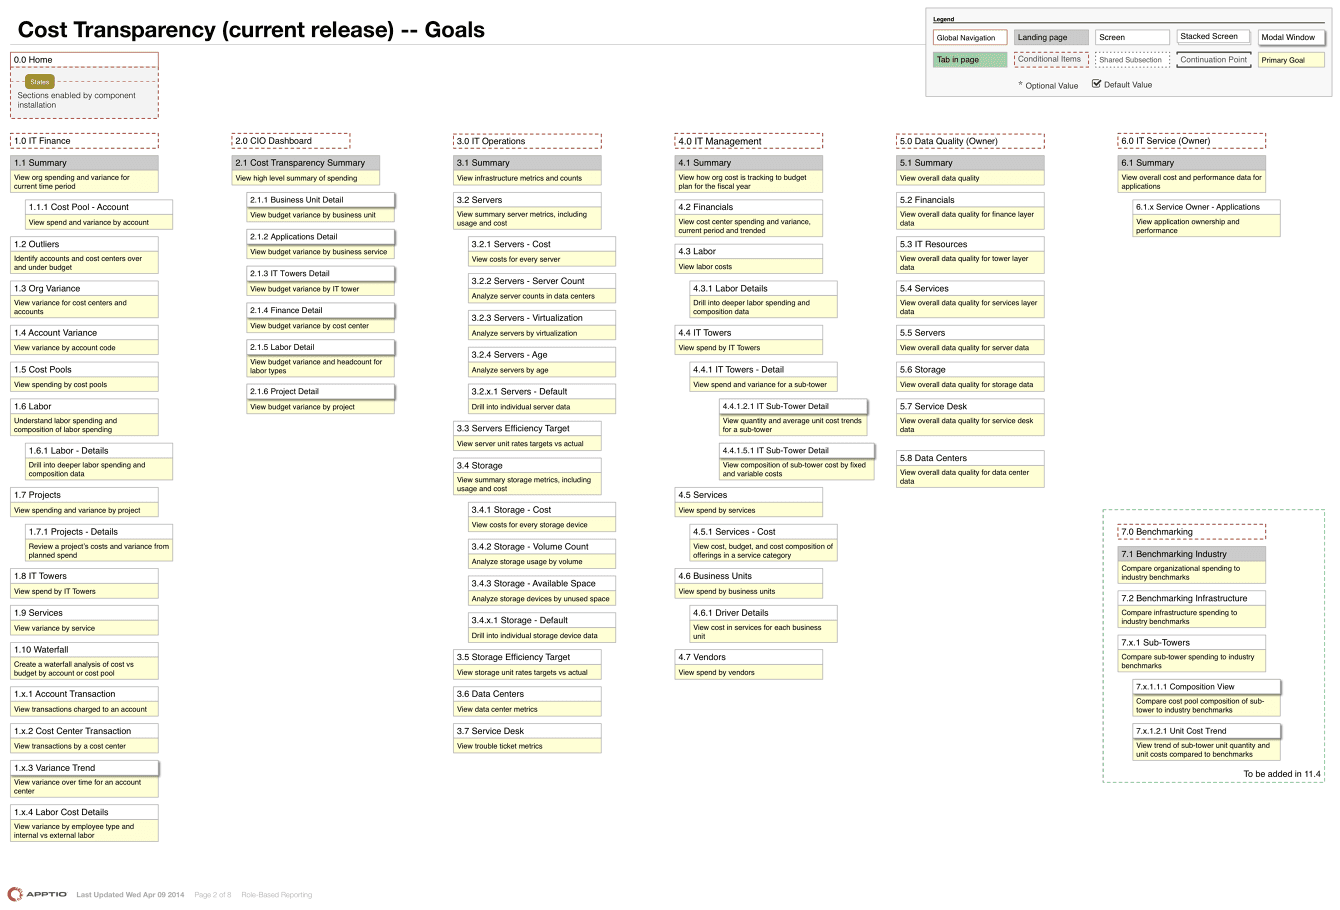
Created an in-house design language documenting all 96 reports, cataloging their primary actors, user goals, data visualizations, filters, and organizational scope (wide vs. deep data).
Data Visualization Audit
Inventoried all 275 data visualizations across reports, mapping each to user goals and relevant stakeholders.
Usage Analytics
Analyzed six months of site analytics from approximately 8,000 users. Used email logins to identify job titles for ~1,000 users via LinkedIn, revealing actual usage patterns.
Actor-Based Reorganization
Discovered financial analysts used the system consistently while IT leaders accessed it fewer than monthly. CIOs rarely logged in.
Solution
- Reorganized navigation around six primary user personas
- Emphasized financial reporting sections; de-emphasized CIO-specific reports
- Created "wide" reporting views for executive at-a-glance insights
- Proposed new Cost Center Owner sections (previously underserved)
- Recommended eliminating nine redundant reports
Deliverables
- Site map
- Content inventory