Problem
Apptio provides IT financial and operational modeling for Fortune 500 companies. While customers valued the pre-built reports, they sought capability to conduct independent analysis on their data.
Primary Users: IT financial analysts—essentially the accountants and finance managers within large enterprise IT departments.
Approach
The product team initially considered two patterns: Qlikview's slicer model and Excel's filtering approach. The team selected Excel's pattern because:
- Users already expected Apptio to function similarly to Excel
- Implementation proved simpler
- Qlikview lacked clear interaction affordances
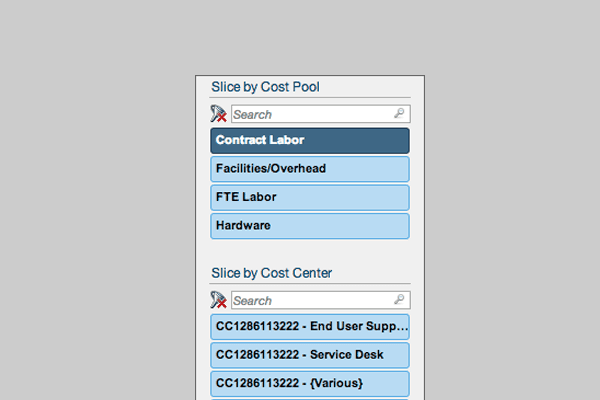
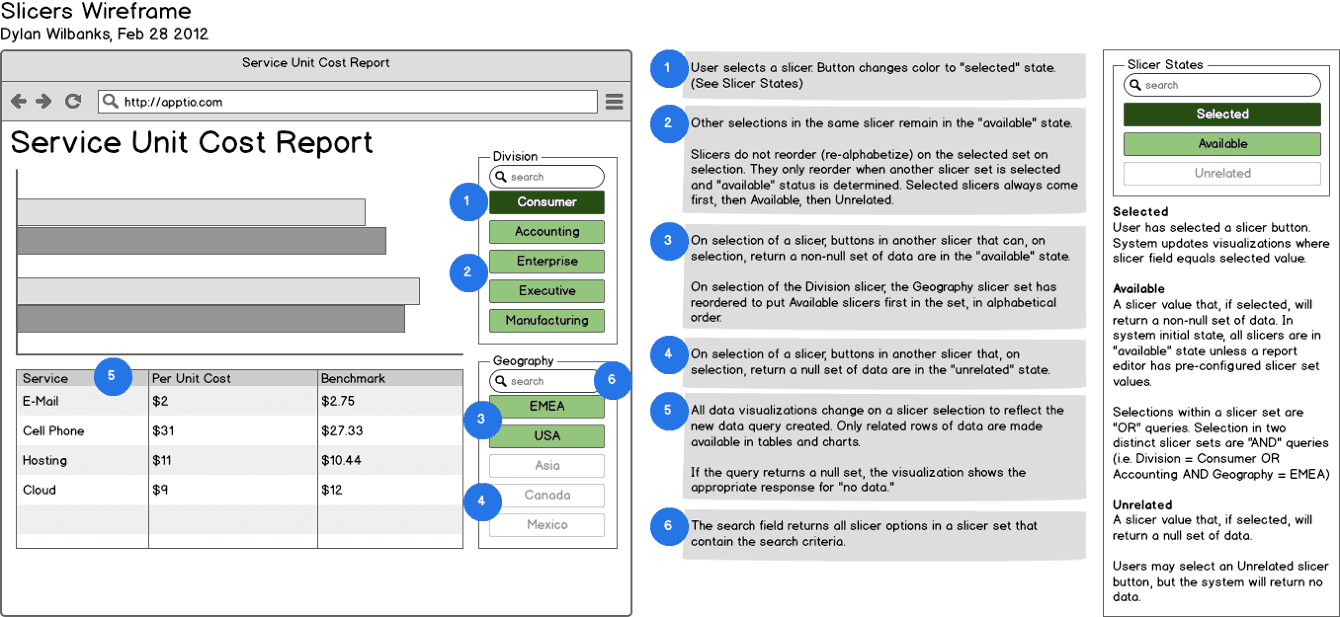
Prototyped slicers using HTML and tested interaction patterns through guerrilla testing. Testing validated a simpler three-state pattern over Excel's four-state model.
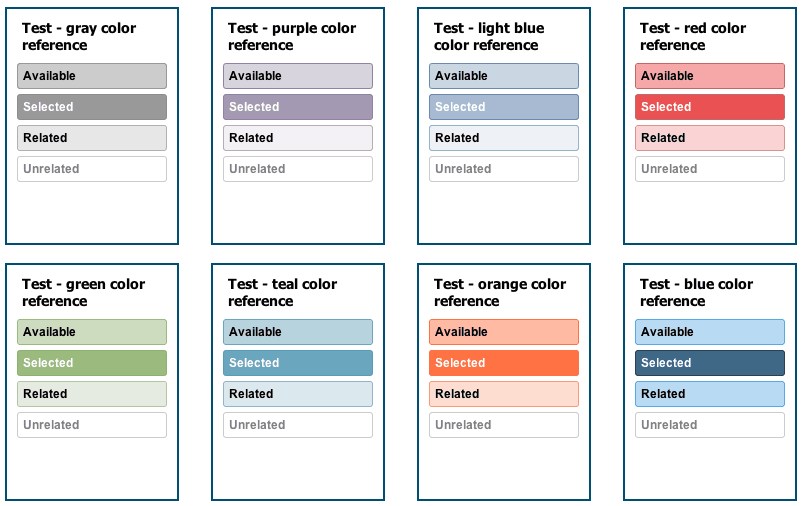
For accessibility, innovatively used WebEx screen-sharing between a remote colleague and myself using a poor-quality projector to identify which color combinations needed adjustment.
Solution
Delivered filtering slicers integrated into Apptio's BI tools. Also conducted customer support training on best practices, emphasizing: "interactions of the BI tools are data just like the data themselves."
When a Fortune 100 client requested a specialized hierarchical organization filter within 8 weeks, rapid-prototyped the UI, created an Axure click-through demo, and gained stakeholder approval. Then pair-designed with developers and conducted usability testing, delivering the filter 2 weeks ahead of schedule.
Outcomes
- Market Differentiator: Slicers became an immediate competitive advantage
- Revenue Impact: New bookings increased 40% year-over-year in the next sales cycle
- Customer Value: One Fortune 100 customer cited slicers as instrumental in an $8 million deal expansion